Turn Odoo Web Builder into a powerful Business-Intelligence dashboard with DevExpress integration!
The DevExpress-Integration Addon integrates the powerful DevExtreme charts library with a huge selection of visualisation components into your odoo application.

Standard Bar
This demo shows the standard bar series type that visualizes data as a collection of bars.
Details
Drill Down
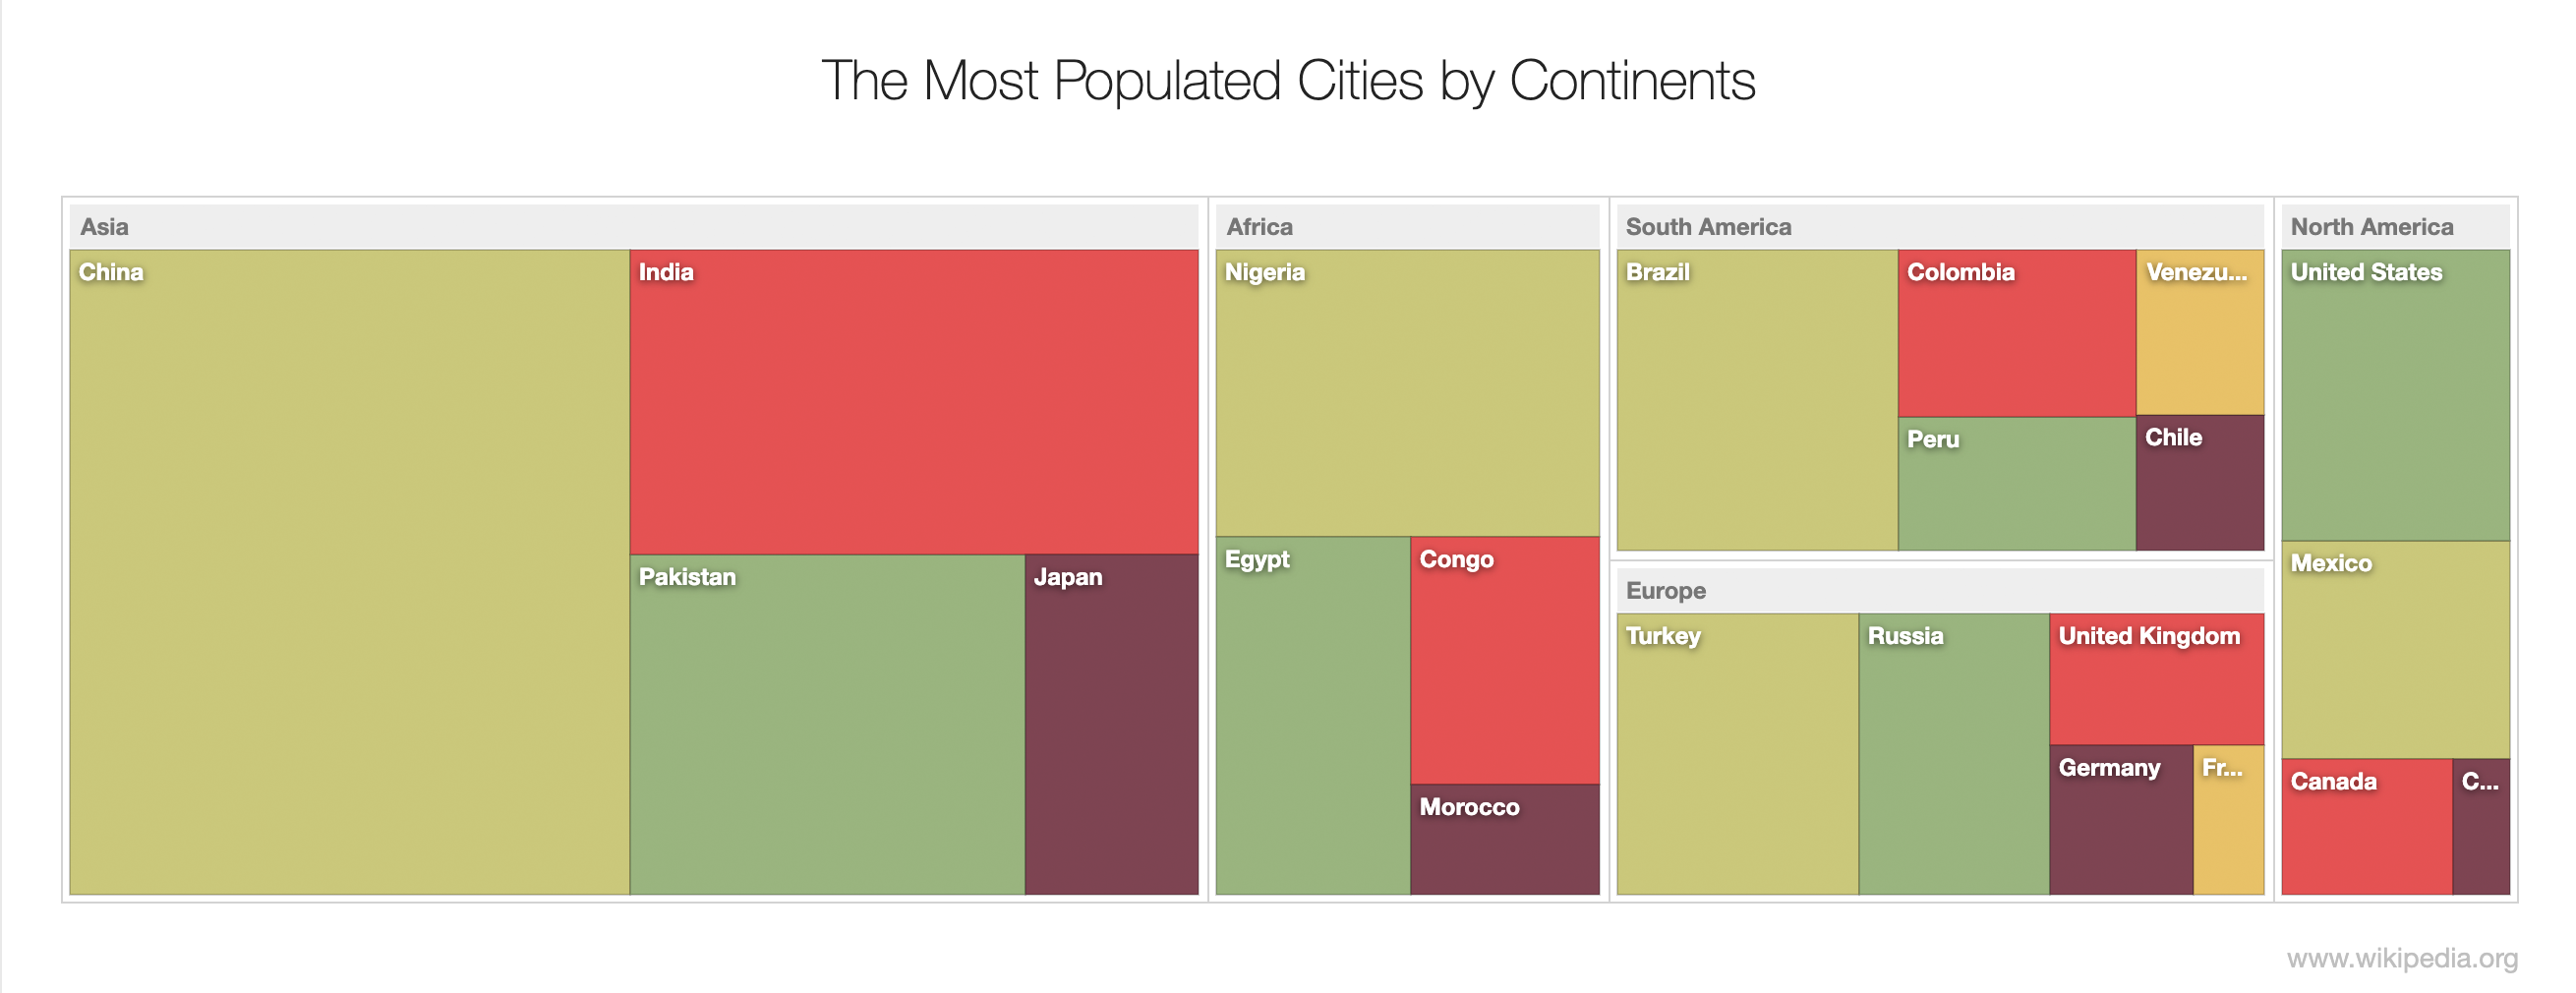
If you bind a TreeMap to a data source with a hierarchical structure, you can enable drill-down and drill-up functionality:
- "Drill down" means navigate to a more detailed view.
- "Drill up" means navigate back up a level.


Speed Gauge
DevExtreme JavaScript Gauge controls are interactive jQuery components for visualizing data on dashboards. They come in two geometric shapes: circular, or radial, and linear. Circular gauges, in turn, can be of two sub-types: regular gauges and bar gauges. In this demo, you can see a simple dashboard with several highly customized gauges. Check out other demos to explore gauge features, like geometry customization, palettes, tooltips, etc.
Details